Written By | Staff Writer
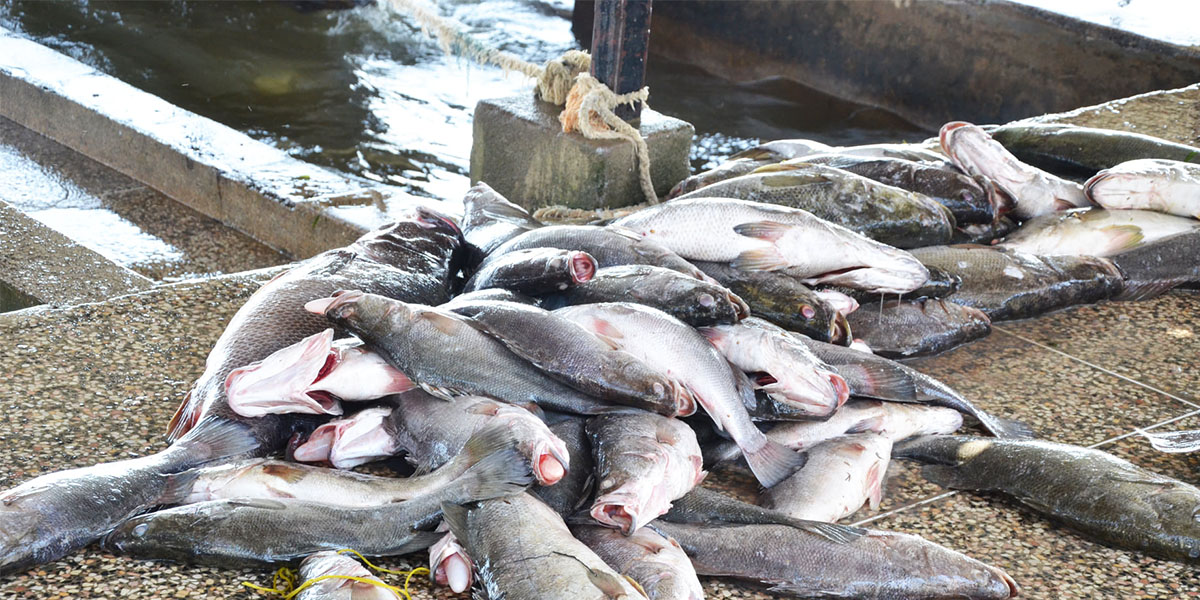
A nationwide survey of fish farmers launched this month will test big promises against a hard baseline: 9,463 farms and 65,444 tonnes of farmed fish.
Agriculture
On Monday 12 October, at Masafu Town Council in Busia District, State Minister for Fisheries Robert Migadde Ndugwa told farmers and district leaders that government had begun profiling fish farmers across the country. The exercise, reported by the Daily Monitor on 13 October, aims to count farmers and ponds and find out what is holding them back. It also asks a blunt question: of the farmers the National Agricultural Advisory Services (NAADS) once helped with ponds, feed and fingerlings, how many are still farming fish?
The timing matters. Six months earlier, the Uganda Bureau of Statistics (UBOS) had released the country's first full Aquaculture Census, covering July 2024 to June 2025. Together, the census and the new profiling drive amount to Uganda's first serious attempt to measure a sector that officials have long described in terms of potential. The numbers they produce are modest, uneven and, in places, at odds with the figures politicians quote.
What the census actually counted
The UBOS census found 9,463 aquaculture farms, of which 6,408 were rural and 3,055 urban. Together they produced 65,444 metric tonnes of fish in the reference year. Nile tilapia accounted for 82.4 per cent of that output (53,924 tonnes) and catfish for 17.3 per cent (11,347 tonnes); mirror carp and other species were negligible. Buganda had the most farms, at 1,270, or 13.4 per cent.
Ponds dominate. According to the census slides, 8,738 grow-out farms use ponds, holding 24,348 ponds in total, of which 17,108 were stocked at the time. Cages, which attract most of the headlines, are used by only 429 farms, with 3,135 cages, of which 1,827 were stocked. Another 198 farms use tanks. Nearly all farms (97.1 per cent) only grow fish out, while a mere 0.8 per cent are hatcheries alone.
The most striking finding is a split between where fish farms are and where fish comes from. The Economic Policy Research Centre (EPRC) notes that rural areas host 67.7 per cent of farms, yet urban farms produce 72.1 per cent of output, some 47,050 tonnes against 18,393 tonnes from rural farms. The Monitor's report on the census describes the same pattern: fewer, highly productive farms in urban areas, and many low-productivity farms in the countryside. A simple division of total output by the 9,390 grow-out farms gives roughly seven tonnes per farm, but that average hides a very wide spread.
Feed, finance and the missing middle
The census explains much of the productivity gap. Feed is the largest operating cost in fish farming, and 86.2 per cent of grow-out farms use some feed. But 59.3 per cent rely on farm-made feeds, and 43.1 per cent on plant by-products and waste, compared with 50.8 per cent that use commercial floating feed. The EPRC links heavy dependence on home-mixed feed to slow growth, high mortality and longer production cycles.
Credit is thin. The EPRC reports that only 410 of 9,190 grow-out farmers had obtained an aquaculture loan, and recommends routing more finance through the Bank of Uganda's Agricultural Credit Facility. Energy is another barrier: seven in ten grow-out farms have no energy source at all, 11.2 per cent use solar and 4.8 per cent are on the grid, which limits aeration and refrigeration. Value addition is almost absent. Fewer than 200 farms can process fish, and 87.8 per cent of output is sold raw and fresh.
Extension coverage is patchy. UBOS found that 53.3 per cent of farms accessed at least one extension service, mostly on feed formulation (77.7 per cent of those served), pond siting and construction (74.5 per cent) and predator and disease control (73.6 per cent). Support for breeding and hatchery management reached only 41.5 per cent, and for value addition and marketing 51.9 per cent.
Busia: a district-sized snapshot
Busia, where the Minister launched the profiling, shows how the national picture looks on the ground. The district has about 620 fish ponds producing under 200 tonnes a year, against an estimated capacity of 400 tonnes. District Fisheries Officer Mary Stuart Nakalembe told the Monitor that its single hatchery produces about two million fingerlings a year, which is not enough for local demand. The hatchery operator, Stephen Odise, produces 2.4 million tilapia, 600,000 catfish and 200,000 maricup fingerlings a year, and said drought has dried up some ponds and caused fish losses.
Farmers named four problems: high and unreliable feed supply, fingerling shortages, drought, and the cost of hiring excavators to dig ponds. The government's stated response is to supply quality fingerlings and feed, set up fish-feed manufacturing facilities, and encourage farmers to form groups to share equipment. The national census suggests those are the right pressure points: the 2025 census counted 273 hatcheries running at about 75 per cent of capacity, meaning supply is constrained by more than hatchery size alone.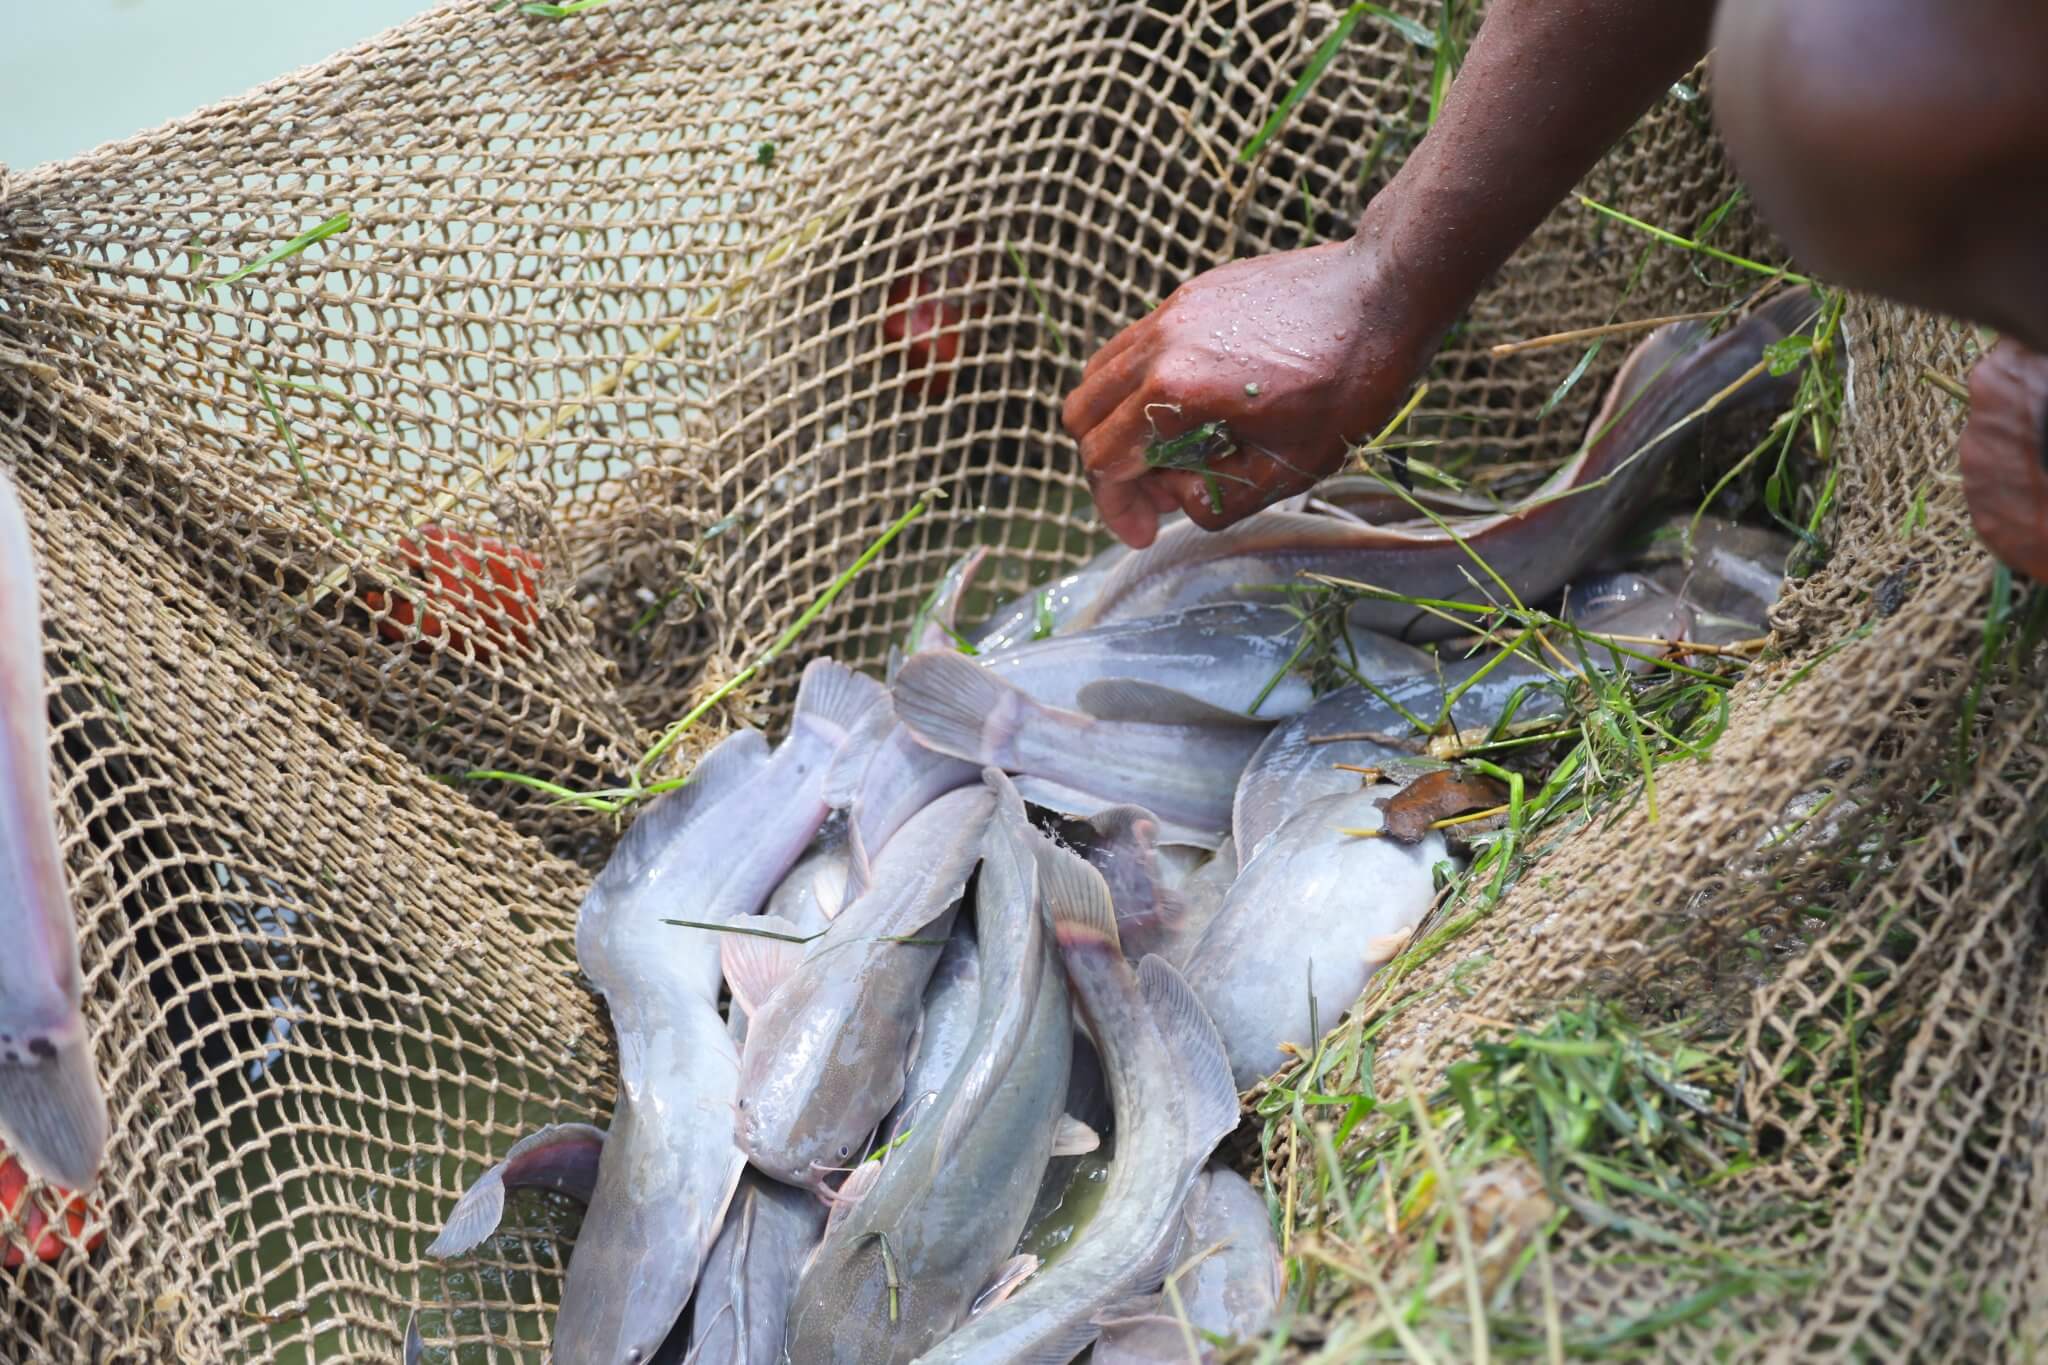
A target and a baseline that do not match
The profiling drive also exposes a gap in the numbers. The Monitor reported the Minister as saying Uganda produces under 750,000 tonnes of farmed fish a year and could reach over two million tonnes, citing Egypt. The census records 65,444 tonnes of farmed fish. The 750,000 figure may be intended to describe total fish output across capture fisheries and aquaculture rather than farming alone; the report does not clarify, and the article's revenue comparison attached to the target also appears garbled. Readers should treat the two-million-tonne ambition as aspirational until the Ministry spells out its baseline.
The census also sits uneasily with the cage-farming boom described in earlier industry reports, which cited farmed output above 100,000 tonnes and 2,000-plus licensed cages on Lakes Victoria and Albert. The UBOS count of 3,135 cages across 429 farms, and 65,444 tonnes in total, is lower, probably reflecting differences in definition, reference period and coverage. It does not settle the question, but it does give policymakers an official, farm-level count to work from, which is exactly what the profiling is meant to extend.
Why it matters beyond the pond
Fish matters economically and nutritionally. The EPRC cites MAAIF data showing fish exports rising from US$155.2 million in FY2023/24 to US$216.4 million in FY2024/25, and UBOS data putting fisheries at 2.0 per cent of GDP and 7.8 per cent of agricultural GDP. Per-capita fish consumption was 15.4 kg in 2023, and fish supplies over half of the average Ugandan's animal protein. At the same time, dried and smoked fish inflation reached 3.7 per cent in September, according to the Monitor, and commercially viable stocks in natural waters have fallen because of chronic overfishing and environmental degradation. Farmed fish is the obvious way to fill the gap, but only if the sector can grow from a base of about 65,000 tonnes.
For farmers, the immediate test of the profiling is whether it leads to something concrete. The EPRC has proposed affordable finance, stronger domestic feed production backed by quality enforcement, solar-powered aeration and refrigeration hubs, a decentralised mobile-enabled extension service, and designated aquaculture zones with shared cold storage and processing, drawing on Egypt's cooperative feed purchasing and China's co-location of feed mills, hatcheries and processors. None of those has yet been funded or scheduled in the reports available.
What to watch
Three things will show whether the exercise is more than a headcount. First, whether the profiling reconciles with the UBOS census and publishes a consistent national baseline. Second, whether the promised fish-feed factories and quality fingerlings arrive before the next dry season. Third, whether finance reaches the farms that, on the census evidence, are the least productive: small rural ponds that use home-made feed, lack energy and sell raw fish. Uganda has spent years debating how big its fish-farming industry could be. For the first time, it has a count of how big it is.